This may seem weird, but I’m giddy to share this big new ADU dataset from the West Coast with you. This is the first time that this big dataset has been presented to the public. Here, I will show why this particular data is so important, and explain why I’m proud to release it.
Getting my hands on this data from California, Oregon, and Washington was difficult. Making it presentable was also a challenge.
But, 10 years ago, this data presentation would have been impossible–because ADU permit data was not collected in any of these states.
10 years ago, even if states had collected this type of data in theory, the scarcity of actual data points would have rendered the policy analysis useless, and the graphs would have been lackluster.
But in 2024, we have three West Coast states that have adopted the ADU religion. Each has passed strong ADU legislation (although Washington’s very strong ADU law, HB 1337, won’t take effect until 2025/2026).
Unlike much of the rest of the country, these three states have preempted the ability of homeowner and neighborhood groups to stop local ADU legislation in its tracks–the common fate of local attempts of reform, especially in wealthy (entitled) areas.
Instead, these states are acting like grownups, and have ended the countless mind-numbing, petty, and fickle local debates about how “ADUs will destroy the character of single family neighborhoods”.
The West Coast is years ahead of all other U.S. states on ADU reforms. These states have taken action.
When it comes to ADU reforms, many of the country’s jurisdictions are like whining children who refuse to eat their vegetables for the 458th time.
Just eat your greens..
Furthermore, these three states have each instituted programs to collect and aggregate that data at the state level.
The West Coast states deserve accolades for both adopting strong reforms, and for collecting the data to track the impact of these reforms.
As a result of these reforms and annual data collection, we are now, for the first time in history, able to make statistical observations about permitted ADUs across the entire West Coast.
Statewide Annualized ADU Permit Numbers on the West Coast
So, let’s get into some charts and basic analysis:


California is the largest ADU producer in terms of sheer volume.
CA total from 2013-2023: 88,885
OR total from 2018-2022: 3,231
WA total from 2010-2023: 8,797
Collectively, this amounts to 100,913 permitted ADUs.
My educated guess is that the rest of the country has fewer than 10,000 permitted ADUs combined, due largely to poor ADU regulations. But other states do not collect jurisdictional ADU permit data, so there’s no way to know this number for certain.
Let’s focus on the five years of annualized data that all three states have: 2018-2022 (Oregon didn’t start to collect its statewide data until 2018 and only collects data for larger jurisdictions).

On a per capita basis, California also leads the pack with 0.0023 ADUs per capita. This means that there’s one ADU for every 441 people in California.

This is probably because California was the first to adopt strong statewide ADU legislation, starting in 2017, and because it has the most expensive housing markets of the three states.
ADUs generally make the most financial sense in more expensive real estate markets, because they leverage the “free dirt” in the backyard of a single family home. Thus, it is more “rational” to build an ADU in California than it is to build an ADU in Oregon.
While the State of Oregon only started to collect ADU permit data statewide in 2018, it is worth noting that Portland was a uniquely dominant ADU Powerhouse City prior to that. In fact, the City of Portland was likely responsible for a considerable portion of the entire country’s permitted ADU production leading up to 2017 because it was one of the only cities in the nation with strong ADU codes up to that point. By 2017, Portland already had 2,449 permitted ADUs.

When we add Portland’s relatively large permitted pre-2017 ADU baseline figure into the mix, which is reasonable for our calculations, Oregon’s total ADU permit count changes from 3,231 to 5,680.
With this adjustment, we can detect an ADU per capita range (0.0011 - 0.0023 per capita) that starts to indicate statistical equivalence.

As we will cover next, Portland’s ADU leadership mantle has been squarely handed over to Seattle and Los Angeles, and a number of other California cities, whose ADU production has recently exploded. Portland’s ADU permit numbers have actually declined since 2018.
My guess is that California’s ADU numbers will continue to climb. And when Washington’s very strong ADU law comes into full effect by 2026, we will start to see its statewide ADU permit numbers soar.
These two states have higher home values overall. California’s home values are 43% higher than Washington’s, and 68% higher than Oregon’s. Thus, it’s likely that California will continue to have a greater adoption rate of ADUs per capita than Oregon and Washington, all else equal.
Observation of the ADU Powerhouse Cities
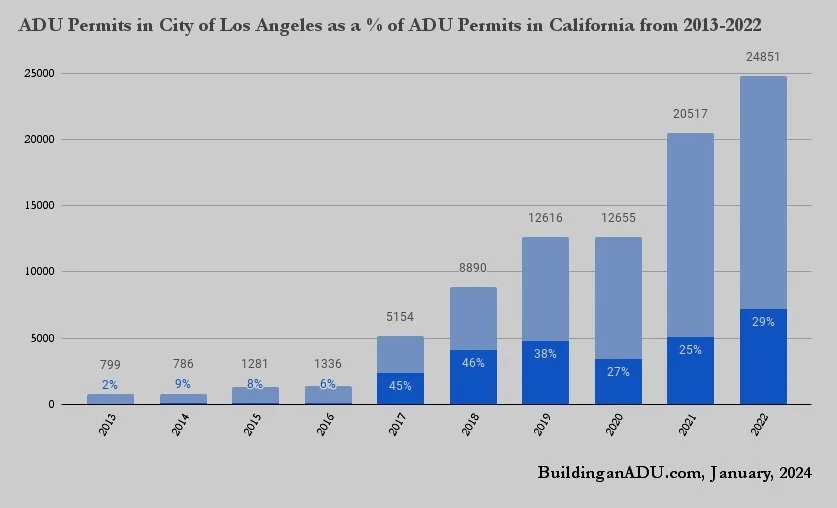
The largest cities in these three states have a disproportionate share of ADU permits, relative to the size of their populations.
Let’s examine the statewide share of ADU permits in the three largest ADU powerhouse cities: Los Angeles, Portland, and Seattle.


On average, these cities are responsible for four times as many of the statewide ADU permits than they “should” be, compared to the size of their respective populations.

What explains the ADU Powerhouse City phenomenon?
1) These ADU Powerhouse Cities were ahead of their peers in adopting strong ADU codes, meaning they met or exceeded AARP’s model ordinance standards. These ADU Powerhouse Cities have had the strongest ADU codes amongst their state peer cities for the longest period of time:
L.A.’s code became strong in 2017
Portland’s code became strong in 2010
Seattle’s code became strong in 2022
2) The cottage industry to support their development is the most robust, due the sheer population size of the market. In other words, there’s sufficient motivation for builders, designers, lenders, and realtors to specialize in the niche ADU market, because that market has sufficient critical mass of homeowner ADU demand.
3) Other factors require contextual insight to add color to the story that the data tells us:
In L.A., people saw their neighbors converting unpermitted ADUs to legal permitted ADUs, and this inspired them to consider the idea for themselves
In Portland, ADU tours - and abundant ADU educational offerings - have helped to normalize ADUs and foster a greater familiarity with this novel form of development.
In Seattle, half of the ADUs are built as condo units by professional developers – and condo developers are able to build more ADUs at scale than homeowners can.
But even so, the saturation rate of ADUs per household is still low - only about 1.4 - 2.2% of households (based on household sizes as listed here) have an ADU, even in these ADU powerhouse cities.

On a per household basis, Portland still leads the pack, but just barely. We’ll get back to these ADUs per household figures in a moment.
Top Ten ADU Producing Jurisdictions in Oregon, Washington, and California
Here’s a peek at the top ten ADU producers in each state.

It would be a useful exercise to normalize each city’s ADU production against its population size. That would help us to identify ADU Powerhouse City outliers on a per capita basis.
ADU Permit Data Inaccuracy and Constructive Criticism
There is a large discrepancy between what permit data the state collects from cities, and what cities sometimes post on their own websites.
For example, in this chart provided by the City of Seattle in its own annual report, you’ll see that Seattle's data is a year ahead of the state's reported data. Perhaps this is due to the administrative processes of how the state aggregates the data… government is slow and ADU permit numbers typically aren’t available right away.

The year that the State of Washington reports out Seattle’s data appears to be delayed by one. When I correct for a year lag in reported data, most of the inconsistency in the data is explained.
However, even when corrected, it's still up to 20% off for some years, such as 2011, 2013, and 2018.

Perhaps this 20% disparity is due to clerical errors. Or perhaps it relates to which department in the City of Seattle reports this data to the state, versus which department posts the data in the City of Seattle.
While it is admittedly frustrating to have inconsistent data published between cities and subsequently by States, it’s not surprising to me.
Even within Cities, queries to various municipal departments (e.g., planning and zoning, GIS, publicly available databases) can result in wildly different numbers.
I’m not just picking on Seattle and Washington. Indeed, this type of data disparity is also present in data that comes from the City of Portland and other cities whose ADU permit data I’ve looked at closely.
Consistent database standards for housing permit data would be helpful. It's just not prioritized or legislated in a manner that is meaningful, apparently. Perhaps in the coming years, these West Coast cities and states will be able to focus on data normalization and protocols that create consistency in permit data reporting, to assist in policy-making efforts.
Even so, I’m confident that, while the exact numbers shown in this data are most certainly not the precise numbers of permitted ADUs for the correct year in each jurisdiction, they are nonetheless sufficiently representative to be valuable as means to draw broader generalizations about ADUs, and to be used for other statistical correlations and causations that housing policy researchers may seek to analyze in the future.
As a proxy for understanding the relative scale of ADU development and for policy-making purposes, annualized and aggregated state datasets are absolutely the best tool available, which is why I’m giddy to share this one.
The Big ADU Dataset
I’m proud that I was able to collect, aggregate, and display this wonderful and rich data for you, dear reader. This ADU data was not yet published anywhere in a format that is available to the public until now. I happened to know the right people in the right organizations to help me get this data, and I happen to care enough to normalize and publish it. Otherwise, this ADU data may never have seen the light of day.
From the point of obtaining this data in their original source formats, it took hours of data wrangling to create this clean spreadsheet. As a gift to the academic and policy-making community, I’m presenting this full data set as an Excel spreadsheet file (.xlsx). While I am publishing it for public use, please credit BuildinganADU.com if you do reuse it in the future.
My intent is to foster further analysis by academics, statisticians, policymakers, and ADU advocates to draw additional conclusions.
My hope is that more individuals will conduct even more complex analysis, import external data such as home value data from MLS, Census data such as income levels and household size, or GIS data such as parcel size and lot configurations to make more insightful statistical correlations than me.
What other variables may predict where ADUs will explode in popularity next? In aggregate, this dataset has the potential to propel urban planning hypotheses forward, and to prove many other hypotheses dead wrong.
Up to this point, there was very poor data about ADU permit trends for factors that are difficult to pinpoint, but they likely relate to a lack of state legislative prioritization and direction to municipalities to collect housing permit data in a standardized way.
We are ADU housing policy Neanderthals' fumbling in the dark, playing darts.
In the absence of good data, only through incredibly deep experiential understanding of ADUs could subject matter experts like me generate viable hypotheses about the impact of regulatory policies that stymy their development.
The data itself has been inadequate for drawing absolute conclusions up to this point. To the extent that it could have helped, the analysis would’ve been flawed, because the data has been so fragmented, sparse, and not normalized.
Actual policy conclusions are very granular and contextual. Even with the assistance of big data, many other factors will likely play into what type of ADU movement we could expect to see.
For example, one day in the future, with big data, we may be able to predict which cities have the “most affordable ADU potential”, by analyzing cities that have snout houses built in the 1970s (ripe for a garage conversion because they have no off-street parking requirements), who have larger households or a severe housing shortage, or whose households own their property for sufficient years (such that they have the accrued equity), because interest rates are dropping to below X%.
Perhaps one city has a sufficient freelance construction labor market and cottage industry that is capable of working with homeowners to build custom ADUs and has the capacity to do so, while a different market only has a limited supply of laborers who are already aligned with professional developers and, therefore, the construction of custom ADUs is not possible. But, while this latter city would lack the capacity for custom ADU development, it may be an especially ripe market for prefab ADUs.
We may be able to determine which neighborhoods have sufficient demand for housing development, and where an entrepreneur should focus their energy and financial resources to do condoization of ADUs. An entrepreneurial company can offer to ‘buy the backyard’ for $150K because they can speculatively make the costly development of a detached ADU pencil out. Indeed, we are seeing the sketched contours of this business model started to occur in the Bay Area, Austin, and Seattle.
The Wildly Inaccurate Data Analysis of Freddie Mac
In the many articles written about ADUs, you’ll note a paucity in statements about how many ADUs there are. That is because, prior to this post, there was no data to make such claims. This data makes such data speculations defensible, as I have done earlier, where I speculated that there are likely 110,000 permitted ADUs in the US.
Where such claims do exist, they came from other methodologies, such as this MLS study of ADUs based on real estate listing text mining conducted by Freddie Mac in July, 2020. But, this report from Freddie Mac is wildly inaccurate if we’re interested in looking at the number of permitted ADUs… It’s off by orders of magnitude! That is because this study included informal ADUs. The problem is that the gap between formal and informal ADUs is vast. Their study concluded that:
“In 2000, 1.6% of active for-sale listings had ADUs. By 2019, the share of active for-sale listings with ADUs had grown to 6.8%. In terms of numbers sold, less than 9 thousand or 1.1% of homes sold on MLS in 2000 had ADUs. By 2019, sales of homes with ADUs grew to nearly 70 thousand or 4.2% of homes sold on MLS.”
In the most prolific markets in the entire country (i.e., Portland, L.A, Seattle), only ~2% of all households have a permitted ADU. As it stands currently, Portland has the most ADUs per household of any large US city, as described in the Powerhouse Cities section, and only 2.2% of households have an ADU in Portland.
So it is grossly inaccurate to state that 6.8% of all homes in the US have an ADU. The answer may be more like 0.068% or 0.0068%. While I wish 6.8% of all US homes had permitted ADUs, we’re probably 100 years away from that day.
Freddie Mac’s research does show that realtors are now more likely to state that a listing has an (informal) ADU because the concept of an ADU has become popularized in the last decade.
While the Freddie Mac research is misleading in terms of conveying how many ADUs there are, it is helpful in showing how large the demand has become for ADUs.
The delta between the number of informal ADUs (6.8% of households) and the small number of permitted ADUs per household (0.068%?) shows the potential of better ADU codes to help bring permitted ADUs into being.
Obstructive ordinances prevent the legal development of permitted ADUs, and cause informal ADUs to flourish.
I raise Freddie Mac’s study to show the importance of the data that I have collected here. Unlike Freddie’s Mac reliance on MLS textual data, the data that I am presenting is based on actual permitted ADUs — inspected and approved by building inspectors.
Conversely, MLS textual data is based on mythology and marketing and hopes and dreams. It has no bearing on the reality of how many actual permitted ADUs there are.
The researchers of the Freddie Mac study were working with the best information that they had and using a logical method. Federal, state, and local policy is made based on research done by entities like Freddie Mac.
But I can tell you that my data is (relatively) right, whereas MLS textual data is very misleading. Those numbers could result in problematic analysis of policy causation and impact.
I’d like state and local governments to clean up their building permit data so that we can get a better understanding of ADU policy.
Fun with Dynamic ADU Charts
Finally, from this link, you can see annualized ADU permit charts from all cities up and down the West Coast.
Here’s the graph of ADU permit data from Berkeley, California.
Here’s the graph of ADU permit data from Bend, Oregon.

Or, this one from Bellingham, Washington.

Ever wondered how many ADUs have been permitted in your West Coast city?
Wonder no longer.